Data Analytics
Completed: 2025
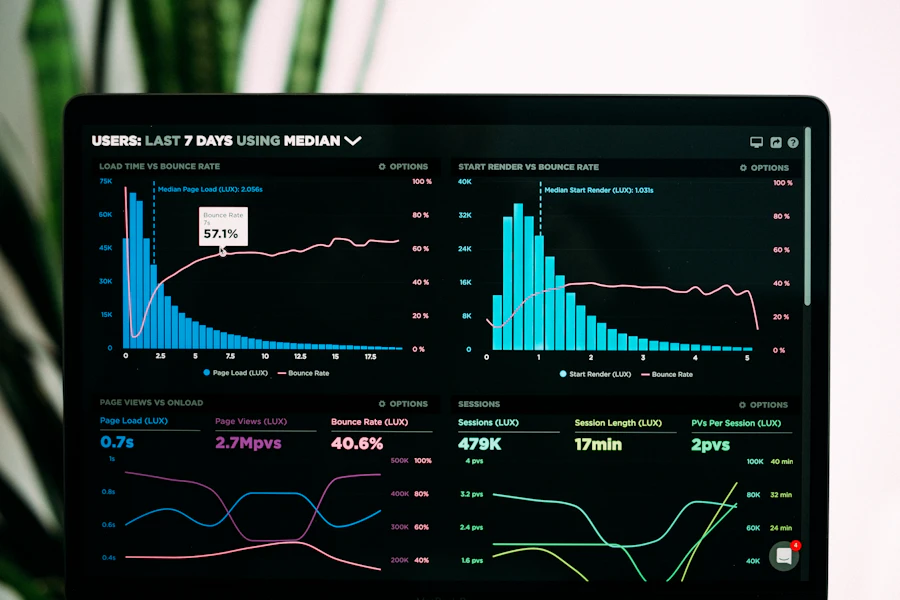
Business Intelligence Dashboard
Comprehensive analytics platform for a retail chain, processing 50M+ transactions daily with real-time insights and predictive analytics.
6 months
duration
8 specialists
team size
35%
efficiency gain